Humanities Academic Services collects and collates academic data reports to help faculty and departments understand student demographics, enrollment trends, graduation rates, and more.
The Business Intelligence (BI) Portal, which provides access to institutional data stored in the Enterprise Data Warehouse (EDW), allows us to run reports on student demographics, course enrollments, and GPA segmentation. These reports are useful for various purposes, such as identifying graduating students for celebrations, identifying students eligible for awards or scholarships, and tracking course waitlist sign-ups. HAS also generates quarterly census reports for department Chairs after the 10th day of each quarter, with an archive of these reports available by quarter and year.
How to Use BI Portal and Run Reports
Entering the Portal
- To get to the BI Portal, select your address bar, and search biportal.uw.edu (bookmark this page).
- You will first be prompted to continue through your Microsoft security settings followed by entering your UW NetID login.
- Once successfully logged in and verified, you will be taken to the BI Portal landing page.
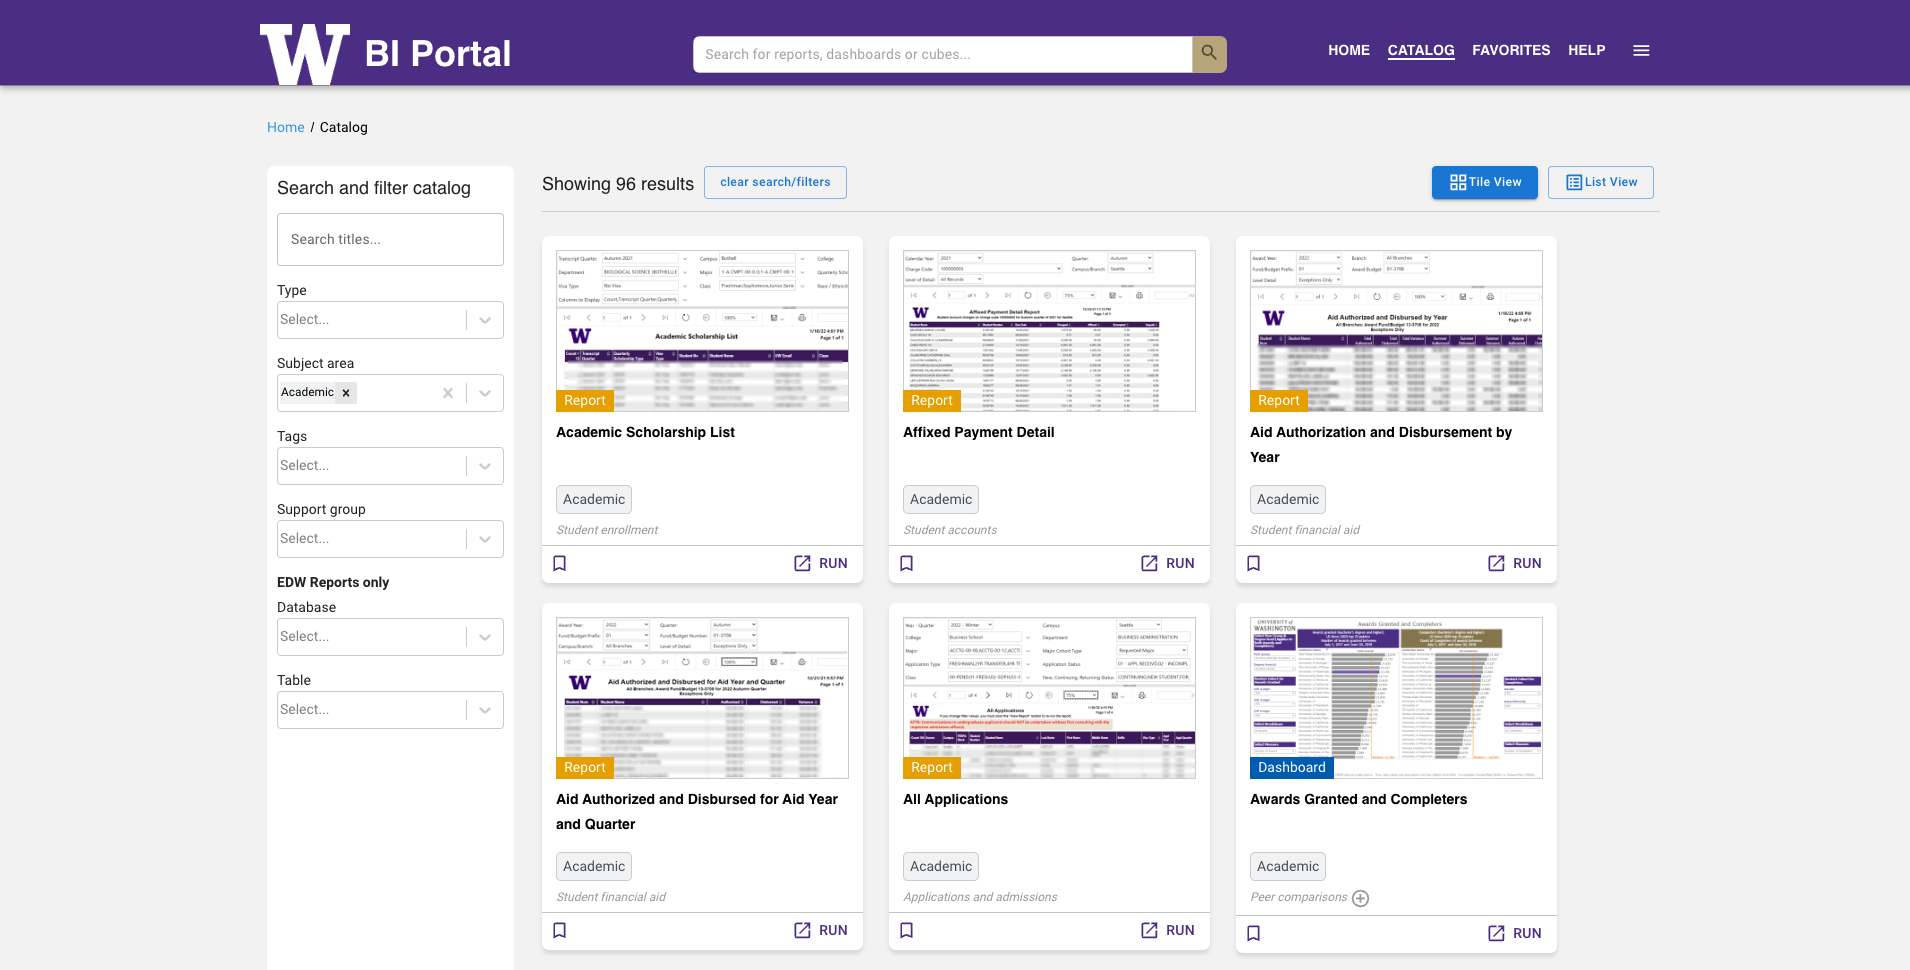
Home Page
- There are over 1,000 reports, dashboards, and cubes available through the BI Portal. For our purposes, Under ‘Browse by Subject Area’, select Academic to narrow down the items displayed on this page.
- To learn more about a specific report, click on the report name for information on the purpose of the report, how the report is used, and definitions of terms used in that report.
Run Report
- To run a report, click the Run Report button. This will navigate you away from the BI Portal to the reporting software.
- If prompted, enter your Net ID login, and then run the report according to your desired results by selecting the appropriate filters. Once run, the data will load in the browser.
BI Portal Introduction
Frequently Run Key Reports
-
Current roster of registered or no longer registered students for each course by curriculum, course and section. Useful for seeing registered student information, sending emails to the entire class list, and determining course overload issues.
-
- Displays a graph of the unduplicated headcount by department as of Census Day for a specified quarter for the past ten years.
-
This report displays a list of students who have applied for and/or were granted a degree for one or more years or quarters.
-
- Creates a roster of undergraduate students within a selected department who have filed a graduation application for an upcoming quarter. Useful for monitoring graduation applications and for creating email lists to contact graduating students.
-
This report provides a list of undergraduate students that are considered eligible to register for courses in a given quarter.